To provide data quality capabilities, erwin Data Intelligence (erwin DI) integrates DQLabs as data quality analysis partner. DQLabs profiles your metadata to provide in-depth analysis of your environments, tables, and columns. This integration enables you to derive data quality parameters in the erwin DI's Metadata Manager.
This topic walks you through a brief idea about how DQLabs integrated with erwin DI and profiles data to deliver data quality analysis. To get a better understanding on how DQLabs profiles data, refer to the Getting Started topic in the DQLabs user guide.
The data quality analysis for an environment includes the following parameters:
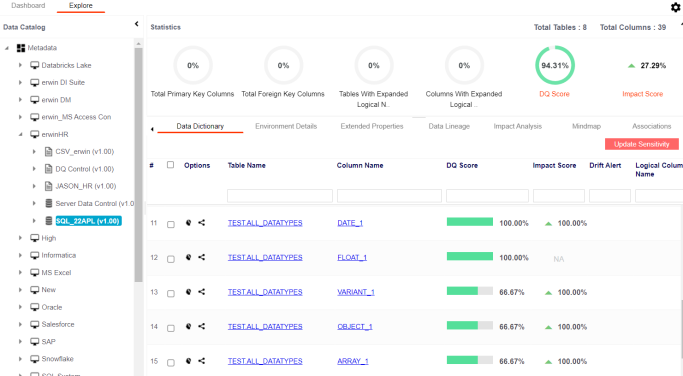
- DQ Score: Displays the profiled data quality score by analyzing the quality of the data across environments, tables, and columns in your metadata.
- Impact Score: Displays the percentage data that impacts environments, tables, and columns.
- Drift Alert: Displays data drift alert based on the data changes, anomalies, and behavior analysis of the tables and columns in your environment. To view drift alerts, refer to the Enabling Drift Alerts using DQLabs topic.
For more information on other data quality parameters, refer to the Data Quality Scores topic in DQLabs user guide.
To view data quality parameters in erwin DI, ensure that you configure DQLabs with erwin DI. For more information about DQLabs configuration, refer to the Configuring DQLabs topic.
erwin DI and DQLabs use different names for identifying the assets. Refer to the following table to understand how erwin DI and DQLabs maps data between applications.
|
Technical Asset Mapping |
|
|---|---|
|
erwin DI |
DQLabs |
|
Environments |
Catalogs |
|
Tables |
Datasets |
|
Columns |
Attributes |
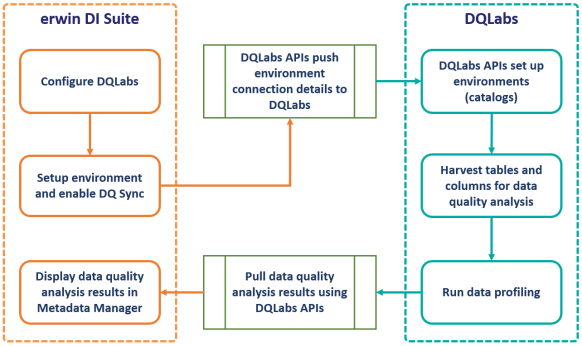
The following diagram shows a high-level architecture and data flow between erwin DI and DQLabs.

The following sequence gives a high-level understanding of how erwin DI and DQLabs integration works to get data quality analysis:
- Create an environment and switch the Enable DQ Sync option on.
- Scan metadata from data sources.
- DQLabs APIs push the environment connection details from erwin DI to DQLabs.
- Select a catalog in DQLabs. The environments in erwin DI are created as catalogs in DQLabs.
- Add datasets to the catalogs in DQLabs for data profiling.
- Run data profiling on datasets to derive data quality analysis.
- Enable drift alerts for the attributes in the datasets.
- Run a data sync job in erwin DI to pull data quality analysis results of an environment from DQLabs and view them on erwin DI.
To view data quality analysis, in the Metadata Manager, expand a system node and select an environment. The environment's data quality analysis is displayed on the Data Dictionary tab. For example, the image displays DQ Score, Impact Score, and Drift Alert for the tables in the selected environment. You can click them to drill down and view column level data quality analysis.

In the DQLabs application, you can:
|
Copyright © 2022 Quest Software Inc. |